A cash flow tracking dashboard is the real-time control panel that shows money coming in and going out so you can avoid surprise shortfalls and act fast. In this article you’ll learn what this dashboard shows, why it matters, how to set one up, common mistakes to avoid, and the long-term impact on liquidity and growth.
Key Takeaways
-
A cash flow tracking dashboard gives instant visibility of cash balance, inflows, outflows, AP/AR, and forecasts.
-
Use daily and 30-/90-day views to spot gaps and plan financing or cuts.
-
Integrate with QuickBooks, Xero, bank feeds, and your CRM for live data and fewer errors.
-
Track burn rate, cash conversion cycle, and cash flow ratio as core KPIs.
-
Build scenario models (best/worst/most likely) on the dashboard to test decisions.
-
Avoid mixing profit accounting with cash timing — focus on cash receipts and payments.
-
Many government small-business resources recommend monthly cash projections as a foundation for planning.
What Is a Cash flow tracking dashboard?
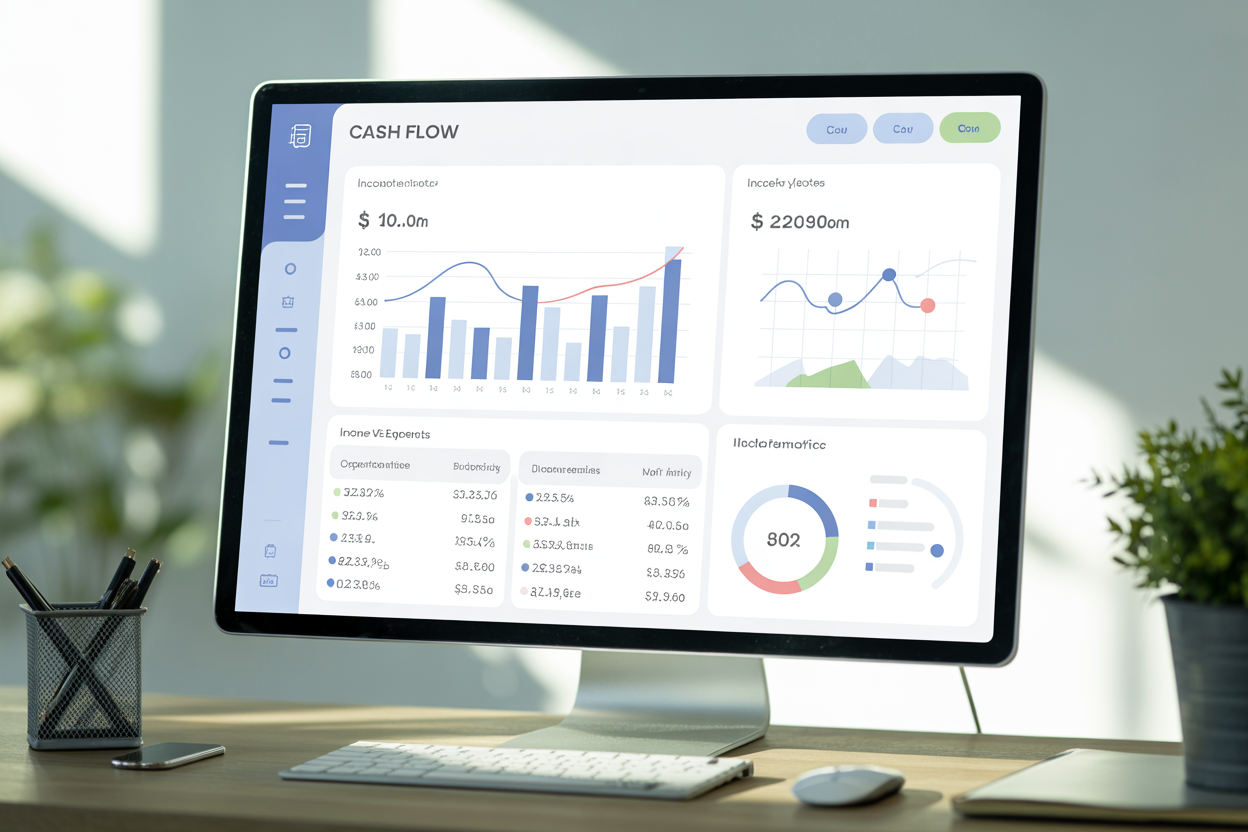
A cash flow tracking dashboard is a visual, dynamic interface that aggregates bank balances, open invoices, upcoming bills, and forecasts into one place. It updates frequently (often in real time) by connecting to accounting software, bank feeds, and sales systems so you can see current cash, net cash flow, and expected cash over the next 7–90 days. The dashboard typically uses charts (lines for trends, bars for category comparisons) and tables (AP/AR aging, receipts schedule) to translate raw transactions into decision-ready metrics.
Core components
-
Cash balance & movement (today + running total).
-
Forecasts (next 7, 30, 90 days).
-
Accounts Receivable & Payable windows.
-
Operational KPIs: burn rate, CCC, cash flow ratio.
Why Does a Cash flow tracking dashboard matter?
Small businesses and finance teams that rely on infrequent reports often miss timing problems — profitable months can still run out of cash. A cash flow tracking dashboard turns static reports into proactive signals: it highlights when payroll or supplier payments will create a shortfall and gives time to act. Industry leaders and accounting platforms emphasize forecasting to avoid liquidity crises. For example, QuickBooks explains that cash-flow forecasting shows if and when you’ll run out of money so you can plan corrective actions.
Evidence & context
Government small-business guides recommend regular cash projections as part of sound financial management, because planning reduces surprise funding needs.
How to Build a Cash flow tracking dashboard (step-by-step)
-
Connect data sources. Link bank feeds, QuickBooks/Xero, payment processors, and your CRM.
-
Set baseline cash balance. Pull today’s reconciled bank balance as the starting point.
-
Import open AR and AP. Map invoice due dates and supplier terms to expected cash movement.
-
Create forecast rules. Use historic receipt timing (or AI predictions) to estimate when invoices will actually pay.
-
Design KPI tiles. Show burn rate, CCC, cash conversion days, and cash flow ratio prominently.
-
Add scenario buttons. Allow “stretch cash 10%”, “delay payroll 7 days”, or “collect 50% AR now” scenarios.
-
Automate alerts. Push notifications for impending negative balances or threshold breaches.
Visualization tips
-
Use a 30-day line chart for near-term rhythm and 90-day bars for monthly cash range.
-
Include an AP/AR aging table with clickable invoice details.
Can you see examples and a simple comparison table?
Example scenarios
-
Startup with monthly subscriptions: daily dashboard shows churn-driven cash declines and signals a pricing change.
-
Seasonal retailer: weekly forecast shows the gap before holiday sales and prompts short-term financing.
-
Services firm: AR aging tile highlights large overdue invoices that explain an otherwise healthy P&L.
Comparison table: Dashboard views at a glance
| View | Purpose | Key widget |
|---|---|---|
| Daily cash snapshot | Immediate liquidity | Cash balance + today’s net cash flow |
| 30-day forecast | Short-term planning | Line chart + AP/AR due list |
| 90-day scenario | Strategic planning | Scenario selector + KPI deltas |
| KPI panel | Operational health | Burn rate, CCC, cash flow ratio |
What mistakes should you avoid when using a Cash flow tracking dashboard?
-
Confusing profit with cash. Don’t assume revenue equals banked cash — timing matters.
-
Relying on unclean data. Inaccurate bank mapping or unreconciled transactions spoil forecasts.
-
Ignoring aging detail. A single large overdue invoice can create a false sense of security.
-
No scenario testing. A dashboard without “what if” models is only descriptive, not prescriptive.
Quick fixes
-
Reconcile weekly, not monthly.
-
Tag recurring items and automate their mapping.
-
Add buffer thresholds (e.g., minimum 14 days of runway) and alert rules.
When does a Cash flow tracking dashboard deliver long-term impact?
Over time, a disciplined dashboard transforms reactive finance into a strategic advantage: better negotiation on supplier terms, smarter hiring cadence, and targeted draws on credit only when modelled scenarios require it. Companies that forecast regularly can reduce emergency financing and make capital allocation decisions (hire, invest, pause) with confidence. BLS survival data and public business guides underline the importance of planning and monitoring for long-term survival.
Conclusion — What to do next
Start by connecting your primary accounting tool (QuickBooks/Xero) and a single bank feed to a simple cash flow tracking dashboard. Build a 30-day forecast, add AP/AR tiles, and set one actionable alert (e.g., “notify if projected balance < 7 days runway”). Iterate weekly: dashboards become more accurate as data quality improves.
Expert insight / Statistic
Industry accounting platforms stress forecasting: QuickBooks notes cash-flow forecasting helps identify when you’ll run out of money so you can chase invoices or adjust spending. Government business guides also recommend regular cash projections to manage capital and reduce surprises.
FAQs
What exactly does a cash flow tracking dashboard show?
A cash flow tracking dashboard shows current cash balances, incoming receipts, outgoing payments, short-term forecasts, and operational KPIs like burn rate and cash conversion cycle.
How often should I update my cash flow tracking dashboard?
Update frequency depends on volume: daily for high-volume businesses; weekly for most SMEs; monthly is too slow for active cash management.
Can I build a cash flow tracking dashboard in a spreadsheet?
Yes — a spreadsheet plus bank/exported AR/AP can work, but connecting directly to accounting software gives better accuracy and reduces manual errors.
Which KPIs matter most on a cash flow tracking dashboard?
Core KPIs are cash balance, net cash flow (period), burn rate, cash conversion cycle, and cash flow ratio.
Does forecasting on the dashboard need AI?
No — basic forecasting uses invoice dates and patterns; AI helps improve timing accuracy but isn’t required for effective short-term planning.