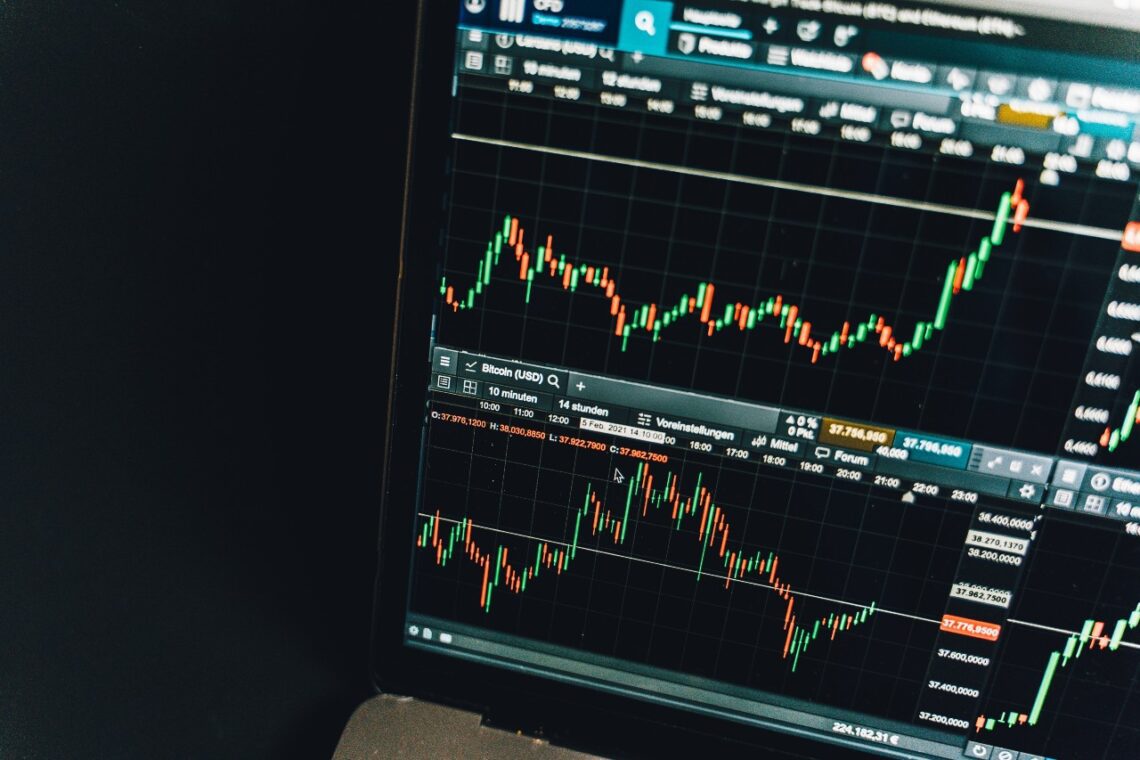
How Professional Traders Use Price Action to Trade
Price action represents the fluctuation of a security’s price over time, a foundational concept in trading. It emphasizes analyzing price chart patterns to guide trading decisions, offering insights into market sentiment and potential price trajectories. Price action trading operates on the principle that price and volume encompass all vital information about a security. Thus, instead […]
How Professional Traders Use Price Action to Trade Read More »

